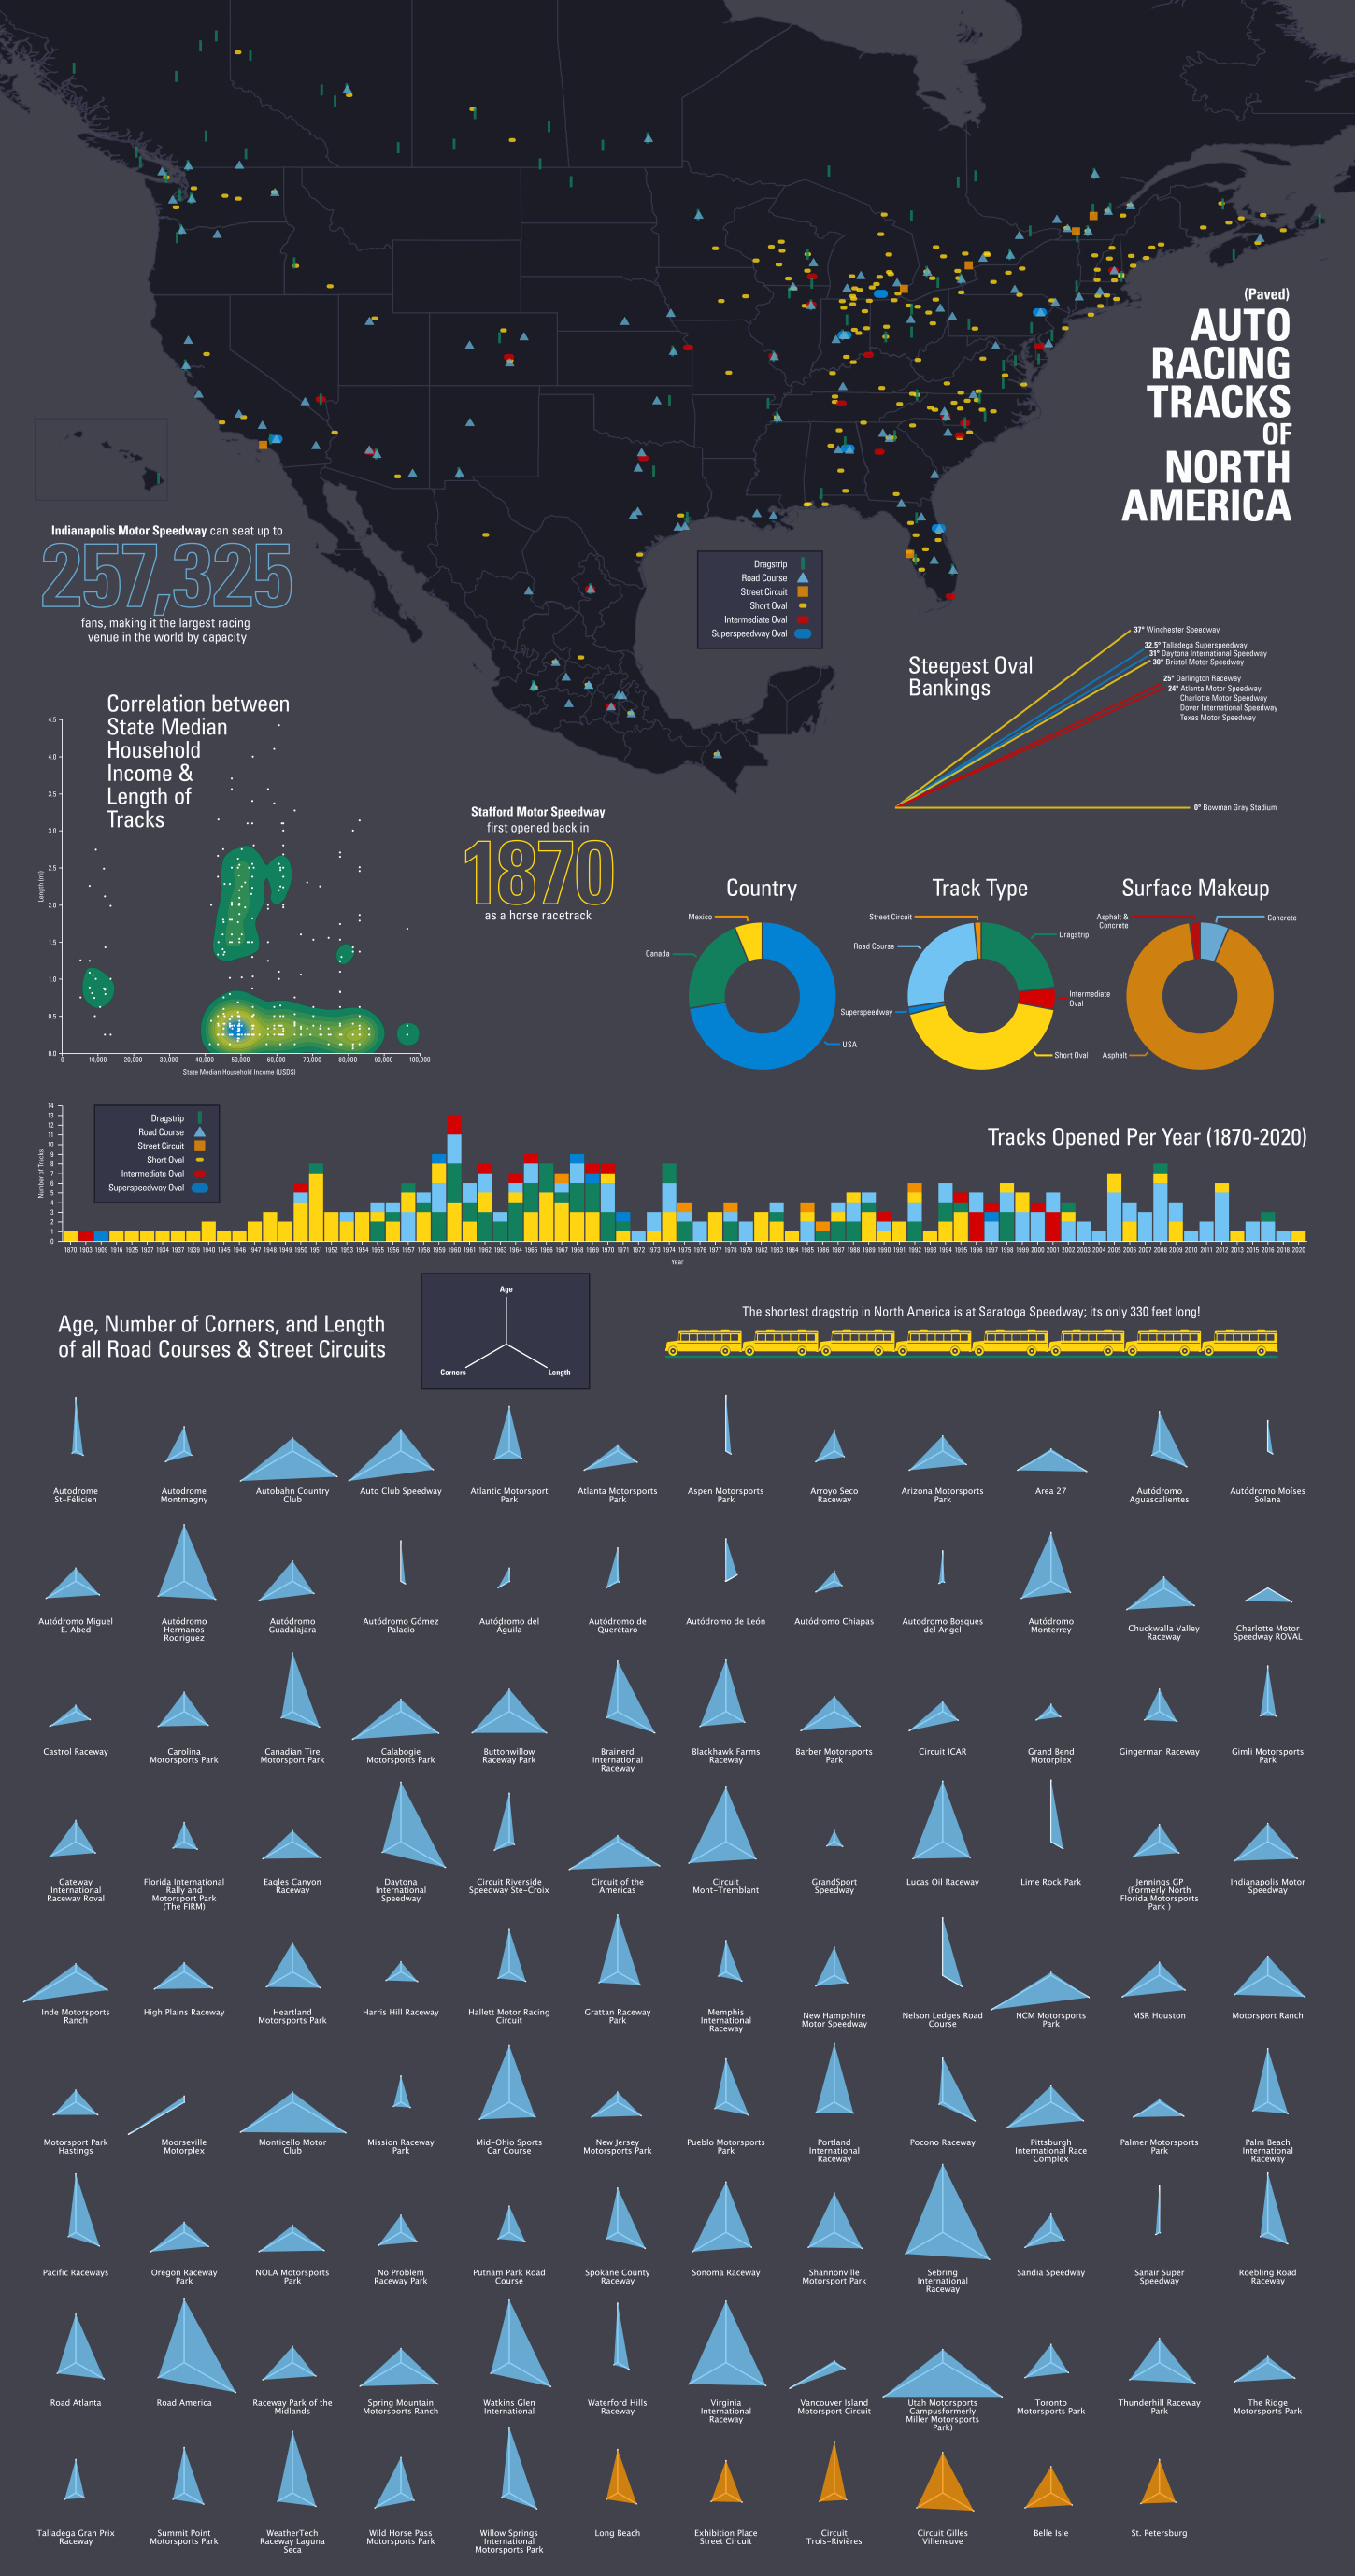
I was challenged to create an informative and engaging data visualization about a topic I am knowledgeable on. I coded specific data tools in Processing to output the map and radar chart, and used RawGraphs.io for the rest of the visualizations.
Interested in learning more about my work or how we can collaborate on an upcoming project? Reach out today.


